As a procurement manager or production supervisor, when you review a quotation for Linear Alkyl Benzene (LAB), is your first instinct to compare the price per ton? This instinct is natural, but in today’s competitive market, true cost savings aren’t determined by what you spend on raw materials—they are determined by how much value those materials ultimately create for your operation.We define this as your Total Manufacturing Cost.

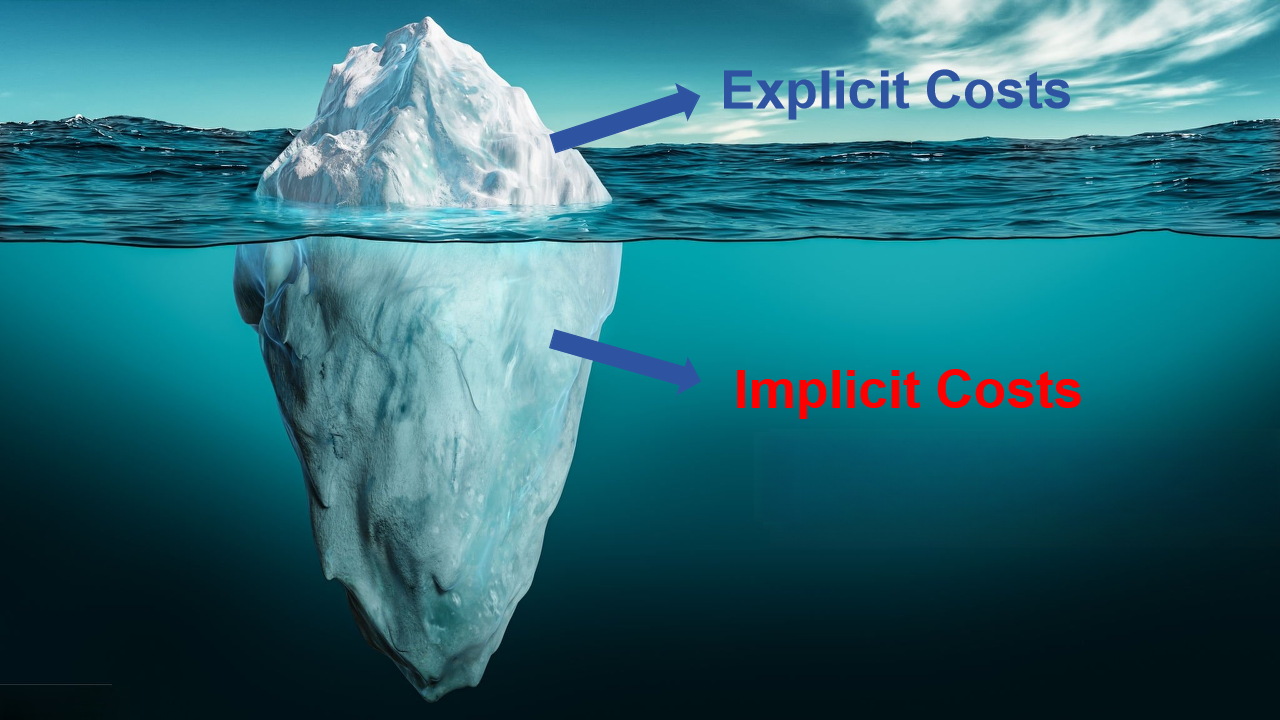
Price is Not Cost: The Hidden Part of the Iceberg
Imagine two batches of LAB arriving at your facility. Batch A is $50/ton cheaper than the market average, while Batch B carries a slightly higher price. On the surface, choosing Batch A appears to be a smart, cost-saving move. However, the real financial story begins when these raw materials enter your sulfonation reactor.
Low-purity or inconsistent LAB inevitably introduces a series of “hidden costs”:
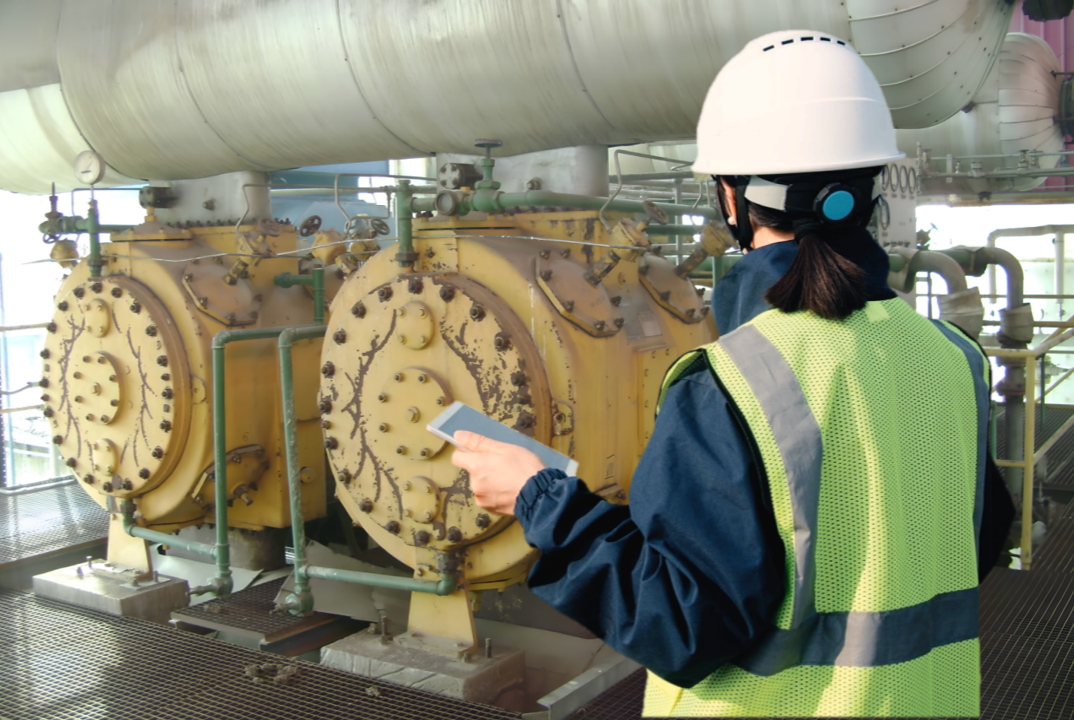
Accelerated Sulfonator Fouling: Impurities force more frequent production shutdowns for reactor cleaning, increasing maintenance hours and consumable parts.
Lower Active Matter Yield: To meet the final specifications for your sulfonic acid, you must use more of the lower-purity LAB feedstock.
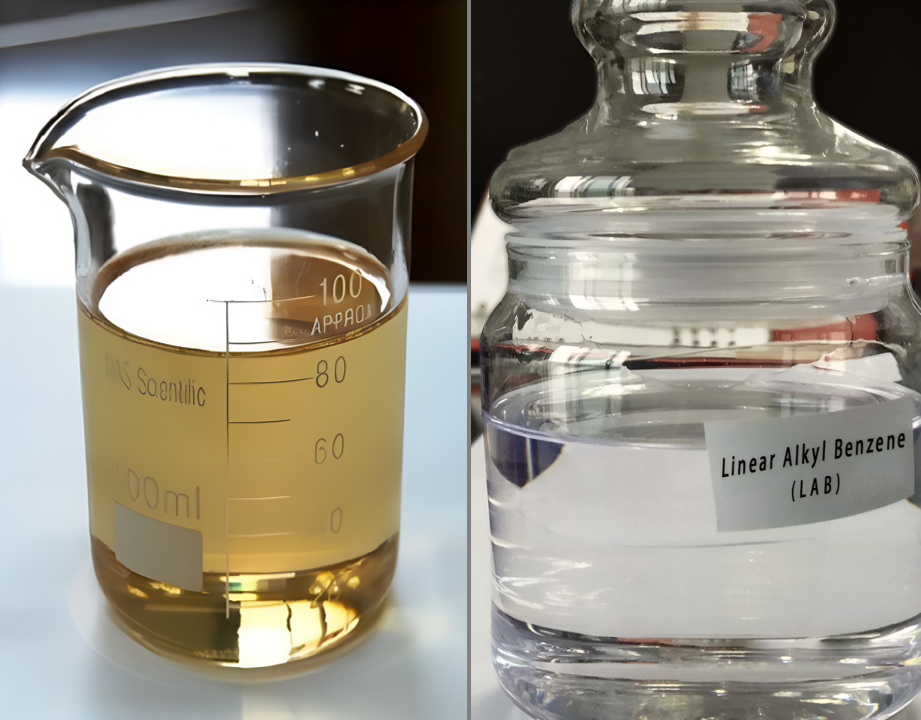
Difficult Neutralization: Darker by-products affect the appearance of your final detergent, potentially leading to customer returns or forcing price reductions.
These costs, lurking beneath the surface, often consume the $50 you “saved” on the initial purchase.
Translating LAB Quality Metrics into Financial Data
Let’s translate standard laboratory data into direct financial language. In a previous article, “Mastering LAB Quality Metrics,” we discussed the Bromine Index, Sulfonatables, and 2-Phenyl Content. These are not just numbers on a Certificate of Analysis; they are key variables that impact your profitability.
1. Sulfonatables Content
Consider two LAB samples with Sulfonatables content of 98.5% and 99.5%. What does this 1% difference mean for your bottom line? To produce one ton of sulfonic acid, you need approximately 10 kg more of the lower-purity LAB. If your plant produces 10,000 tons of sulfonic acid annually, this 1% gap means you consume an extra 100 tons of raw material per year—a direct loss potentially amounting to hundreds of thousands of dollars.

2. Bromine Index (BI)
A high BI indicates a high level of unsaturated hydrocarbons. During sulfonation, these components not only consume more sulfonating agents (like SO₃ or oleum) but also tend to form colored by-products and tarry residues. This directly increases your refining costs and degrades product quality, limiting your ability to sell into premium markets.
3. 2-Phenyl Content
This metric directly influences the biodegradability and solubility of the resulting product, LAS. While seemingly an environmental metric, in regulated markets like Europe, slower biodegradation due to improper 2-phenyl content can lead to higher environmental taxes or strict market access barriers.
Case Study: The Cost of Invisible Waste
To visualize this, let’s simulate a simple cost comparison:
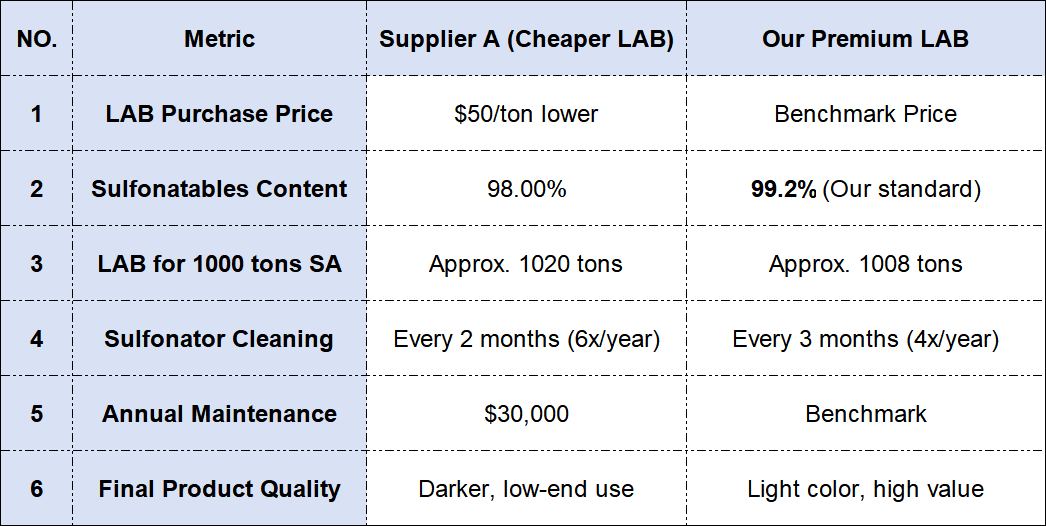
In this model, although Supplier A’s unit price is lower, the total manufacturing cost associated with their material is significantly higher than the premium LAB produced by our factory.
Why a Source Manufacturer Delivers Greater Value
As a source manufacturer of LAB, we are fundamentally different from traders or intermediaries:
End-to-End Quality Control: From incoming raw materials to finished products, every batch is rigorously tested in our in-house laboratory.
Customized Solutions: As the producer, we can adjust parameters to ensure our LAB fits seamlessly into your specific sulfonation line.
Long-Term Stability: We own our production facilities. We won’t halt supply due to market fluctuations.
Transparent Processes: We can explain our production technology in detail, giving you insight into the source of every quality characteristic.
Rational Advice for Procurement Teams
We recommend establishing a comprehensive Supplier Scorecard. Don’t just look at the unit price. Focus on:
Quality Consistency: Are the Bromine Index and Sulfonatables content stable between deliveries?
Technical Support: Can the supplier provide in-depth data to help you optimize your process?
Supply Chain Reliability: The cost of production downtime outweighs any raw material price difference.

Start a Professional Conversation
We invite you to move beyond the price sheet.
Request detailed product specifications and quality trend analyses.
Schedule a technical consultation with our engineers to discuss your process.
Request our factory documentation, including ISO certifications.
Get a customized quotation based on your volume and quality needs.

Your bottom line is the only metric that matters. We are committed to helping you lower your total manufacturing cost and enhance your market competitiveness.Contact us to Start the Conversation